
When it comes to trading Bank Nifty, two technical indicators can tell us a lot about trend and momentum: the 52-day moving average (52-DMA) and the Relative Strength Index (RSI).
Between 1-Aug-2022 and 22-Sept-2025, we tested a strategy that combines these indicators to identify potential entry points after the index shows weakness. Here’s what we found.
Why 52-Day MA and RSI?
- 52-DMA: Helps spot the medium-term trend and filters out short-term noise.
- RSI: Tracks momentum. Readings below 30 usually mean the index is oversold.
By combining the two, we aim to catch Bank Nifty when it’s weak but ready to bounce back.
The Rule We Used
- Look for days when the closing price falls below the 52-DMA.
- Wait 15 days after this first close.
- If, at that time, the RSI is below 30, that’s our entry signal.
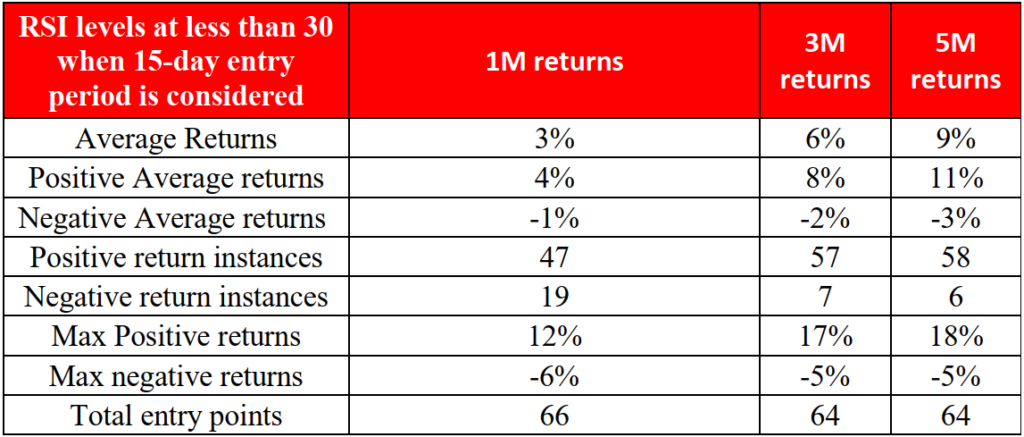
Back test Results (Aug 2022 – Sept 2025)
Here’s what happened when we applied the rule:
Real-Time Test in 2025
We put this strategy into action on 24-Sept-2025. Instead of buying futures or individual banking
stocks, we bought the SBI Nifty Bank ETF, which closely tracks Bank Nifty
- Entry Price: ₹565
- Price on 6-Oct-2025: ₹575.12
- Return: +1.8% in two weeks
The Bank Nifty index itself also gained 1.8% over the same period, showing that the ETF tracked
the index well.
Key Takeaways
- The 52-DMA + RSI < 30 combo helps spot oversold phases that often lead to recoveries.
- Back tests showed consistent positive returns, with limited risk (downside)
- A live trade in Sept 2025 gave a quick 1.8% return in just two weeks.
This makes the strategy a simple, rules-based approach for medium-term traders looking to catch
Bank Nifty rebounds after weak phases.
Please note that the above should not be construed as an advice from us. Our company is in the business of distribution of suitable Financial Products to investors describing product specifications, material facts and the associated risk factors. We are acting as a Distributor for these products and facilitating transactions