
Is Nifty better than Bank Nifty? This is one question that is almost always asked by most investors and especially traders. As Bank Nifty attributes to over 40% of Nifty’s constituents, the indices are obviously highly correlated.
In such a scenario, we will have to dwell deeper when it comes to rating the performance of one relative to another. Find below the ratio line chart of Nifty Bank/Nifty during 2014-23. This chart gives the ratio of Nifty Bank return to Nifty 50 return over time.

A ratio that is trending higher indicates that the return of Bank Nifty is exceeding that of Nifty. As seen above, we could see that the ratio chart is continuously trending higher in the last 10 years, with higher highs and higher lows indicating continuous outperformance of Bank Nifty over Nifty 50.
It is only during the COVID and Post COVID periods (2020-22) that the trend reversed. This can be considered an anomaly. We can see the trend reverting again to its original style since 2022 beginning. Clearly, Bank Nifty has largely outperformed Nifty over the long term.
Let us now come to the stats:
When normal monthly returns are considered, it is observed that Bank Nifty has outperformed approximately 45% of the time over Nifty 50 across all tenures (10, 7 and 5 years).
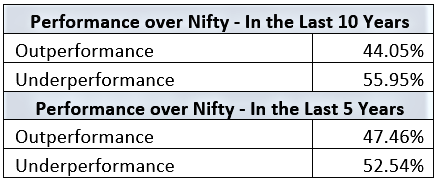
Although the number of instances of outperformance seems low, the absolute performance of Nifty Bank over Nifty 50 is positive.
This is because the average monthly outperformance of Nifty Bank is much higher than the underperformance as seen below.
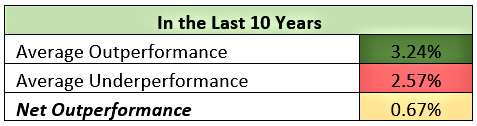
Net monthly outperformance over Nifty 50 is positive at 0.67% on average.
Considering the above factors along with the emerging trend in the ratio chart since 2022, it might be a good idea to go long on Bank Nifty over the long term. Traders could take one step further and implement a Long Bank Nifty Short Nifty strategy for longer periods.